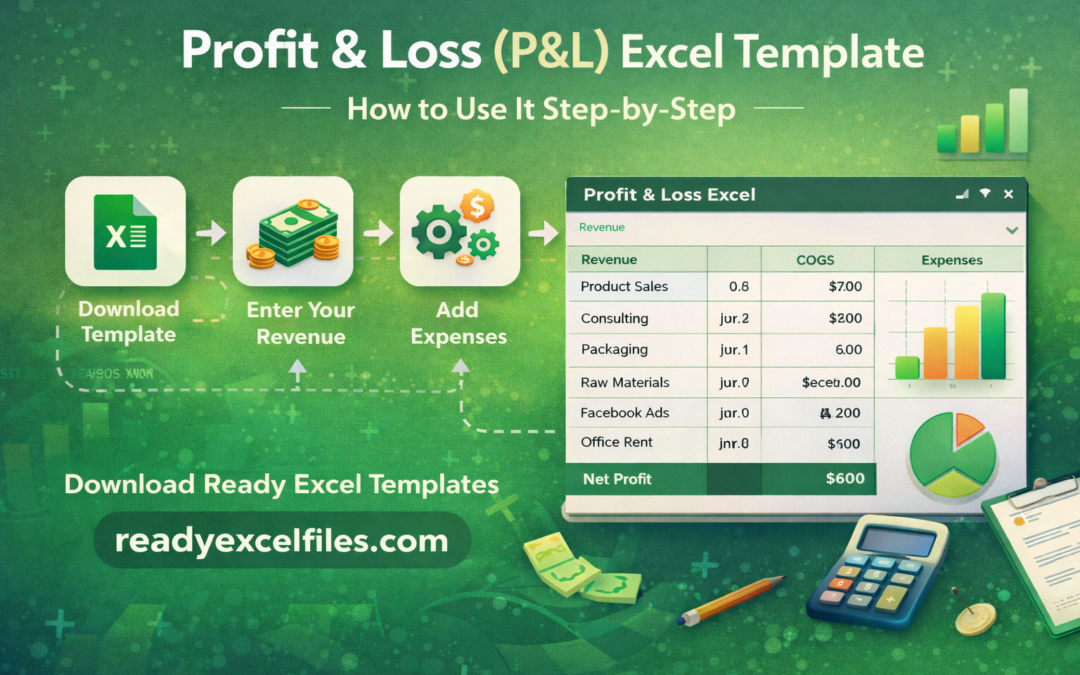
Profit & Loss (P&L) Excel Template: How to Use It Step-by-Step
Managing business finances is one of the most important responsibilities for any entrepreneur or business owner. To understand whether your business is making money or losing money, you need a clear financial report.
Profit & Loss Excel Template How to Use a P&L Spreadsheet Step-by-Step
One of the most commonly used financial tools is the Profit and Loss (P&L) statement.
A Profit & Loss Excel Template helps you track revenue, expenses, and profit in a simple spreadsheet format. With Excel, you can automatically calculate totals and quickly understand your business performance.
In this guide, we will explain what a P&L template is, why it is important, and how to use it step-by-step using Excel.
What is a Profit & Loss (P&L) Statement?
A Profit and Loss statement is a financial report that shows:
Total income (revenue)
Total expenses
Net profit or net loss
It helps businesses understand whether they are profitable during a specific period, such as a month, quarter, or year.
Most businesses use P&L statements for:
✔ Financial analysis
✔ Business planning
✔ Investor reporting
✔ Tax preparation
✔ Expense tracking
Why Use an Excel P&L Template?
Excel is one of the most powerful tools for financial tracking because it allows automation, formulas, and data analysis.
Here are some benefits of using a Profit & Loss Excel Template:
Easy to Use
Even beginners can manage finances with simple Excel formulas.
Automatic Calculations
Revenue and expenses are calculated automatically.
Customizable
You can modify categories according to your business.
Professional Reporting
Create clear financial reports for stakeholders or accountants.
Better Decision Making
Understand where money is coming from and where it is being spent.
Basic Structure of a Profit & Loss Template
A standard P&L Excel sheet includes the following sections:
Revenue (Income)
This section tracks all sources of income.
Examples:
Product sales
Service revenue
Online sales
Consulting income
Cost of Goods Sold (COGS)
These are costs directly related to producing or delivering products.
Examples:
Raw materials
Production costs
Packaging
Operating Expenses
These are regular business expenses.
Examples:
Office rent
Salaries
Marketing costs
Software subscriptions
Utilities
Net Profit
Net Profit = Total Revenue – Total Expenses
This is the most important number in your P&L report.
Step-by-Step Guide to Using a Profit & Loss Excel Template
Follow these steps to use a P&L template effectively.
Step 1: Download the Excel Template
First, download a ready-to-use Profit & Loss Excel template.
Using a pre-built template saves time because formulas and categories are already created.
You can find thousands of ready templates on:
Step 2: Enter Your Business Revenue
Start by entering all sources of income.
Example:
Date Description Revenue
Jan 5 Product Sales $500
Jan 8 Consulting $300
Jan 15 Online Orders $700
Excel will automatically calculate the total revenue.
Step 3: Add Cost of Goods Sold
Next, enter the costs related to producing your products.
Example:
Date Expense Amount
Jan 3 Raw Materials $200
Jan 7 Packaging $50
These costs will be subtracted from revenue.
Step 4: Record Operating Expenses
Now track all business expenses.
Common expense categories include:
Marketing
Advertising
Office rent
Software tools
Salaries
Internet costs
Travel expenses
Example:
Date Expense Amount
Jan 10 Facebook Ads $120
Jan 12 Office Rent $400
Step 5: Review Your Net Profit
Once all data is entered, Excel calculates your net profit automatically.
Formula example:
Net Profit = Total Revenue – Total Expenses
Example:
Total Revenue = $1500
Total Expenses = $900
Net Profit = $600
This means your business made $600 profit for the month.
Who Should Use a P&L Excel Template?
A Profit & Loss spreadsheet is useful for many professionals.
Small Business Owners
Track business income and expenses.
Freelancers
Manage project income and costs.
E-commerce Stores
Monitor sales performance.
Startups
Understand financial performance.
Accountants
Prepare financial summaries quickly.
Features of a Good P&L Excel Template
A professional template should include:
✔ Automatic calculations
✔ Revenue and expense categories
✔ Monthly and yearly summaries
✔ Clean financial layout
✔ Easy editing and customization
✔ Charts or dashboards for insights
Download Ready-to-Use Excel Templates
If you want professional Excel tools without building them from scratch, you can download ready-to-use Excel templates.
At ReadyExcelFiles.com, we provide:
✔ 10,000+ ready-to-use Excel templates
✔ Business spreadsheets
✔ Finance and accounting templates
✔ HR and payroll tools
✔ Budget planners
✔ Project management sheets
✔ Dashboard and analytics templates
Visit our website:
Start working smarter with ready Excel files.